
Measuring return on investment (ROI) for automation from DevOps and CI/CD through DevSecOps is key to securing budget, guiding strategy, and proving value to all stakeholders. ROI answers one simple question: “For every dollar we spend, how many dollars do we get back?”
ROI (%) = (Total Gains – Total Costs) ÷ Total Costs × 100
Below is a practical, step‑by‑step guide covering DevOps, CI/CD and DevSecOps automation ROI.
1. Establish Your Baseline with Key Metrics
Before automating any process, capture current performance:
| Automation Domain | Core Metrics |
|---|---|
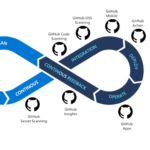
| DevOps | Deployment Frequency, Lead Time for Changes, Change Failure Rate, MTTR |
| CI/CD | Build Success Rate, Average Build Duration, Pipeline Throughput, Change Failure Rate |
| DevSecOps | (All above) + Security Findings per Release, Mean Time to Remediation |
Example:
Deployment Frequency: 4/week
Average Build Duration: 15 minutes
Change Failure Rate: 15%
Mean Time to Remediation: 48 hours
Tracking these before and after gives you clear quantitative evidence of improvement.
2. Calculate Total Investment Costs
Sum every cost related to automation:
Tooling & Licensing
E.g., CI platform subscription $30/user/month; SAST/SCA licenses $50/user/month
Implementation & Integration
Custom scripts, API connectors, pipeline configuration
Training & Change Management
Workshops, documentation, mentoring hours
Ongoing Maintenance
Upgrades, support contracts, rule tuning, incident resolution
Total Cost of Ownership (TCO) = ∑ all one‑time + recurring expenses
Document each item thoroughly—precision here pays off in credibility.
3. Quantify Tangible Benefits
a. DevOps Automation Gains
Faster Releases
Reducing lead time from weeks to days or hours directly accelerates time‑to‑market.
Higher Reliability
Automated rollbacks and canary deployments cut Change Failure Rate by up to 50%.
Efficiency
Self‑service infrastructure and scripted deployments free 20–30% of engineers’ time.
Example Calculation:
If an engineer’s fully‑loaded cost is $150,000/year, and automation frees 0.2 FTE, that’s $30,000 in annual savings.
b. CI/CD Automation Gains
Build Success Rate Improvement
Fewer broken builds mean less context switching and rework—say 90% → 98% success.
Reduced Build Time
Cutting average build from 15 min to 5 min saves 10 min × # builds/day × # engineers.
Throughput
More parallel pipelines can increase deployment frequency by 2× or more.
Example Calculation:
– 50 builds/day × 10 min/build = 500 min saved/day = ~8.3 hours/day.
At $75/hour engineer cost, that’s $625/day or $156,250/year per team.
c. DevSecOps Automation Gains
Early Vulnerability Detection
Shift‑left security tools catch issues pre‑production, reducing remediation cost by ~60%.
Faster Incident Response
Automated alerts and playbooks cut Mean Time to Remediation by 30–50%.
Breach Cost Avoidance
Each prevented high‑severity flaw can save $50,000–$200,000 in breach remediation.
4. Account for Intangible and Strategic Benefits
| Benefit Type | Proxy Value Example |
|---|---|
| Customer Trust | 5% revenue uplift from improved uptime/reliability |
| Brand Reputation | 10% reduction in churn rate |
| Regulatory Compliance | $1,000/day saved in audit prep |
Assign transparent assumptions—e.g., “Improved uptime by 1% yields $100K additional annual renewals”—so these strategic benefits fit into your ROI model.
5. Build Your Unified ROI Calculation Model
List Total Costs
• Tooling & Licensing (Year 1): $200,000
• Implementation & Training: $100,000
• Maintenance (Year 1): $60,000
**Total Cost (Year 1):** $360,000
Sum Quantified Benefits
• DevOps Efficiency Savings: $120,000
• CI/CD Build Time Savings: $156,250
• DevSecOps Risk Avoidance: $500,000
• Intangible/Strategic Proxy Gains: $80,000
**Total Gain (Year 1):** $856,250
Compute ROI
ROI = (856,250 – 360,000) ÷ 360,000 × 100 ≈ 138.4%
Calculate Payback Period
Payback = 360,000 ÷ 856,250 ≈ 0.42 years (≈ 5 months)
6. Presenting ROI to Stakeholders
Executive Summary: ROI %, payback period, top three gains
Visual Dashboard: Side‑by‑side before/after charts of DORA, CI/CD and security metrics
Case Studies: Short narratives highlighting a release or sprint pre‑ and post‑automation
Frame the story:
Leadership: focus on cost avoidance, revenue acceleration, risk reduction
Engineering: emphasize efficiency gains, reduced toil, higher deployment velocity
7. Continuous Measurement and Iteration
Automation ROI evolves as toolsets and processes mature. Quarterly:
Refresh baseline metrics.
Re‑quantify benefits with latest data.
Adjust tooling, rules, and training to drive higher ROI.
This iterative cadence ensures sustained value and alignment with changing business priorities.
Next Steps
Inventory & Costing: Document all DevOps, CI/CD, and DevSecOps tools and costs.
Baseline Capture: Measure key metrics over one sprint or release cycle.
Pilot & Measure: Automate a single process, record before/after data.
Scale & Refine: Update your ROI model, share results, and expand automation.
Following this comprehensive approach—covering DevOps, CI/CD, and DevSecOps automation—empowers you to measure performance, prove value, and continuously improve.
Image credit: Designed by Freepik